Market Sizing for Startups: How to Calculate TAM, SAM & SOM

Bringing a new product to market or launching a startup is exciting, but one of the most common mistakes founders make is skipping market sizing altogether. Market size isn’t just a number for a pitch deck; it’s a reality check that shapes your strategy, influences MVP development; decisions, and determines whether an idea is worth pursuing.
Why Market Sizing Matters for Startups
Before developing an MVP, it’s important to validate whether there is enough real demand for the product. Market sizing helps answer fundamental questions such as:
- Is the market large enough to support a sustainable business?
- Who are the early adopters, and how many of them exist?
- What market share is realistically achievable in the short term?
- Is this idea worth pursuing, or does it need an early pivot?
Market sizing isn’t just a strategic exercise, it directly impacts how a product is developed and evolved over time. It determines your
- Feature prioritization – Helps focus development on what matters most to early adopters
- Go-to-market strategy – Informs pricing, customer acquisition, and scaling plans
- Investor pitching – Strengthens funding conversations with realistic projections
- Pivoting & iteration – Provides clarity when repositioning is needed
How This Guide Will Help You
By the end of this guide, you’ll understand how to calculate market size using frameworks like TAM, SAM, and SOM and how to apply those insights to MVP decisions, funding conversations, and long-term growth and how to use these insights to refine your MVP, secure funding, and build a scalable business.
Let’s dive in!
What is Market Size?
Market size refers to the total demand for a product or service within a defined industry or target audience. It represents the potential revenue opportunity available to a business and serves as a foundation for strategic decision-making.
For startups, understanding market size is essential because it:
- Validates business potential – Ensures there's enough demand before investing heavily.
- Attracts investors – Venture capitalists and stakeholders assess market size to gauge scalability.
- Informs MVP development – Helps prioritize features based on market demand.
- Guides pricing and sales strategies – Ensures competitive positioning and revenue projections.
There are two primary approaches to market sizing: Top-Down Market Sizing and Bottom-Up Market Sizing.
1. Top-Down Market Sizing
This method starts with a broad industry-wide number and narrows it down using filters such as geography, customer segments, and estimated penetration.
Example:
- The global video dubbing market is worth $5 billion.
- The Hindi-speaking market accounts for 20% of it → $1 billion.
- If a startup plans to capture 5% of this segment → potential market size = $50 million.
Best For: Industries with well-documented market data and broad audience reach.
Limitation: Often overestimates opportunity by assuming accessibility and adoption.
2. Bottom-Up Market Sizing
This approach starts with measurable data such as customer counts, pricing, and usage patterns, then builds upward. It offers a more realistic estimate.
Example:
- A startup offering AI-powered video dubbing plans to target 100,000 content creators.
- Each creator spends an average of $200 per year on dubbing services.
- Estimated market size: 100,000 x $200 = $20 million.
Best For: Startups validating MVPs, niche markets, and data-driven projections.
Limitation: Requires deeper research and careful assumptions.
Which Approach Should You Use?
Both methods are useful, but for MVP development and early-stage startups, a Bottom-Up approach tends to be more accurate and defensible. A Top-Down estimate can complement it by providing a broader industry perspective.
Why Should You Calculate Your Startup Market Size?
Understanding Market Potential
Market sizing helps startups and businesses determine whether their idea has enough demand to be viable. Without a clear picture of your market’s potential, you risk launching a product that lacks enough customers to sustain growth.
By calculating market size, you can:
- Validate demand before investing heavily in product development.
- Avoid entering an oversaturated or too-small market.
- Identify the right target audience and potential early adopters.
For example, if your AI-powered video dubbing tool is targeting Hindi-speaking YouTubers, knowing how many creators exist and how much they spend on dubbing services helps you assess if the market is worth pursuing.
Aligning Business and Marketing Strategies
Market size directly impacts how you develop your Minimum Viable Product (MVP), pricing, and marketing strategies.
- Product Development: A large market might justify more feature-rich offerings, while a niche market requires a focused MVP.
- Pricing Strategy: Understanding how much potential customers are willing to pay helps you set realistic SaaS pricing models.
- Marketing Focus: Knowing your market size ensures you target the right audience segments, avoiding wasted ad spend and resources.
For instance, if your market size is small but highly valuable, a premium pricing strategy might be more effective than a low-cost, high-volume approach.
Attracting Investors with Data-Backed Insights
Investors want to fund businesses with high growth potential. A strong market size calculation shows them how big the opportunity is and how much revenue your startup can generate.
Key market metrics investors look for:
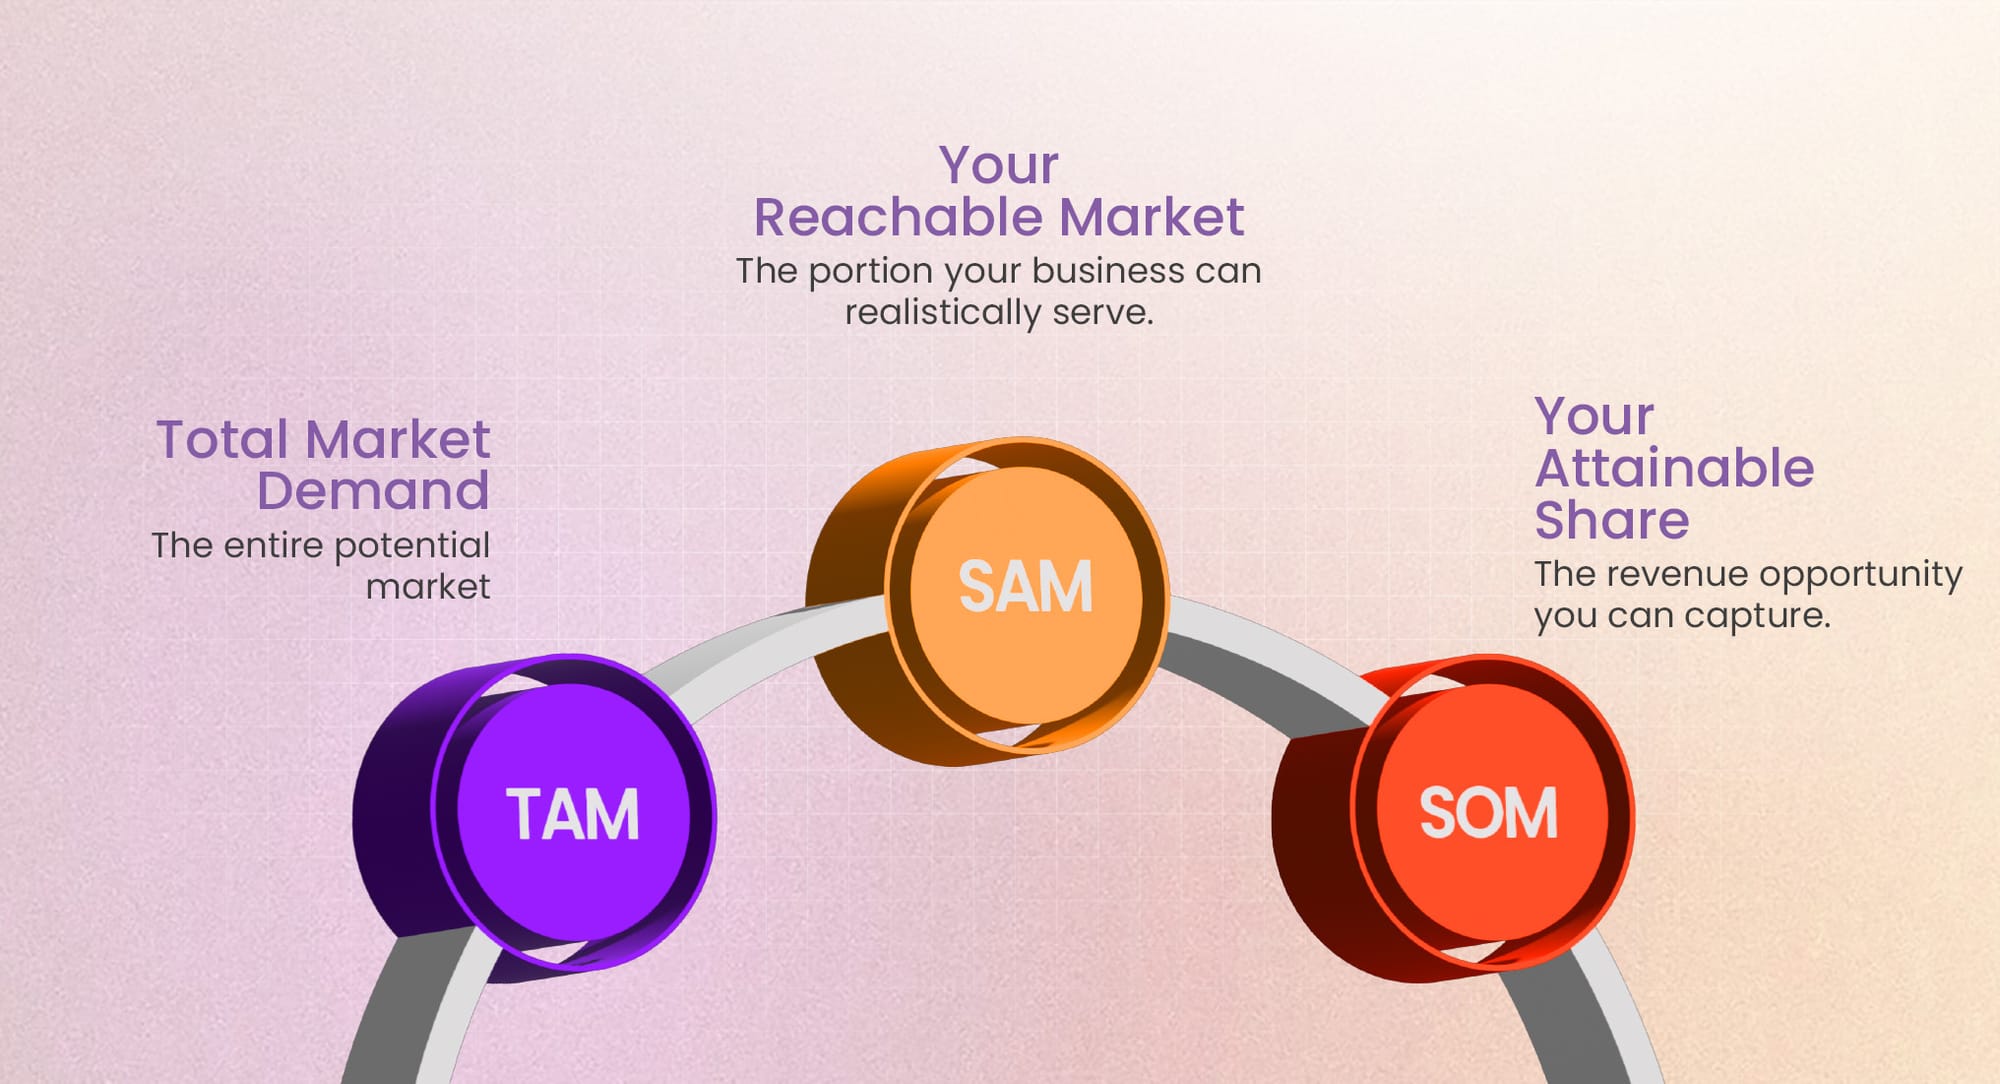
- Total Addressable Market (TAM) – The entire demand for your product.
- Serviceable Available Market (SAM) – The segment you can realistically serve.
- Serviceable Obtainable Market (SOM) – The market share you can capture based on competition and execution.
A well-researched market size calculation makes your pitch more convincing, increasing the likelihood of securing funding.
The Startup Market Sizing Framework: TAM, SAM & SOM
When evaluating market opportunities, businesses use the TAM, SAM, and SOM framework to understand the total market size, the segment they can realistically serve, and the portion they can capture. Let’s break each one down.
Build Lean. Learn Fast.
Launch an MVP that saves money while proving your concept works.
Total Addressable Market (TAM): The Big Picture
TAM represents the total demand for a product or service assuming no competition or constraints, assuming no competition or constraints. It answers the question: “If everyone who could use this product actually did, how big would the market be?”
How to Calculate Your Total Addressable Market (TAM)
There are three main methods:
Top-Down Approach
- Uses industry reports and market research to estimate the total market size.
- Often relies on data from sources like Statista, IBISWorld, or government reports.
- Example: If the global AI video dubbing market is valued at $10 billion, this would be the TAM for an AI dubbing startup.
Pros: Quick and uses existing data.
Cons: Can be broad and less precise.
Bottom-Up Approach (Preferred by Investors)
- Uses real sales data, customer spending habits, and price points to build a realistic market size estimate.
- Multiplies average revenue per customer by the estimated number of potential customers.
- Example: If your AI dubbing tool charges $50 per user/month, and there are 500,000 active YouTube creators in India, your TAM is: 500,000 × $50 × 12 months = $300M/year TAM
Pros: More precise and realistic.
Cons: Requires access to detailed data.
Value-Theory Approach
- Estimates market size based on the value your solution creates for customers.
- Often used for disruptive innovations where traditional market data doesn’t exist.
- Example: If AI dubbing reduces video localization costs by 70%, you can calculate TAM based on the total industry spend on dubbing before AI existed.
Pros: Useful for innovative products.
Cons: Can be speculative
Serviceable Available Market (SAM): Estimating Reachable Customers
While TAM shows the overall opportunity, SAM focuses on the portion of the market that your business can realistically serve based on location, regulations, and business model.
For example:
- If your AI dubbing tool only supports Hindi, Spanish, and French, you’d exclude non-supported languages from your SAM calculation.
- If only 40% of YouTube creators use AI tools, your SAM = 40% of the TAM.
Key takeaway: SAM is a filtered version of TAM, removing segments you can’t reach.
Serviceable Obtainable Market (SOM): Finding Your Realistic Share
Even within your SAM, competitors exist, and you won’t capture the entire market. SOM represents the portion of SAM that can realistically be captured based on competition, execution, and timing.
To estimate SOM:
- Look at your competitive position (e.g., pricing, features, branding).
- Assess industry benchmarks (e.g., new SaaS startups typically capture 2-5% of their SAM in the first few years).
- Example: If your SAM is $120M/year, and your expected market penetration is 3%, then: SOM = $120M × 3% = $3.6M/year
Key takeaway: SOM = Your actual revenue opportunity within a given timeframe.
IN-CONTENT DESIGN:
Here’s how the framework looks visually:
How to Calculate Your Startup Market Size in 3 Steps
Calculating market size helps businesses understand potential demand, align strategies, and attract investors. Here’s a simple 3-step framework to estimate market size accurately.
Step 1: Define Your Target Audience and Market Scope
Before diving into numbers, you need to clearly define your ideal customer and break down the market into TAM, SAM, and SOM.
Identify Your Ideal Customer
- Who will buy your product?
- What industries or demographics do they belong to?
- What problems does your product solve for them?
Example: If you're launching an AI video dubbing tool, your customers could be YouTube content creators, media companies, and marketing agencies looking to localize their videos.
Differentiate Between TAM, SAM & SOM
Once your audience is defined, use the TAM, SAM, and SOM framework to estimate your potential market.
- TAM (Total Addressable Market): The total demand for your product if there were no competitors or constraints.
- SAM (Serviceable Available Market): The portion of TAM that your business can realistically serve.
- SOM (Serviceable Obtainable Market): The share of SAM that you can expect to capture based on your business model and competition.
Example: If the global video dubbing market is worth $10 billion, but only $1 billion applies to YouTube creators (SAM), and you expect to capture 1% of that (SOM), your SOM = $10M per year.
Collect Market Data
There are two primary ways to gather market data:
Using Existing Data Sources (Secondary Research)
- Industry reports (e.g., Statista, IBISWorld, Gartner)
- Government databases (e.g., census data, trade reports)
- Competitor analysis (financial reports, user base, market share)
Example: If Statista reports that 500 million YouTube videos are uploaded monthly, and 10% require dubbing, that helps estimate market demand.
Gathering New Data Through Research (Primary Research)
- Surveys and interviews (ask potential customers about their needs)
- Focus groups (understand customer pain points)
- Beta testing sign-ups (measure real-world interest in your product)
Example: A survey among 100 content creators shows that 70% are interested in AI dubbing solutions, which validates potential demand.
Step 2: Gather Market Insights
Once you’ve scoped your market, it’s time to validate demand and refine projections using detailed market insights.
Consumer Research: Understanding Demand
- What are current pain points in the industry?
- How are customers currently solving the problem?
- What is the willingness to pay for a solution?
Example: Research shows that 70% of YouTubers localizing content use manual dubbing, but AI dubbing is 50% cheaper and 3x faster, indicating strong market potential.
Brand Perception Research: Assessing Competitors & Positioning
- Who are your main competitors, and how do they price their product?
- What are the gaps in existing solutions?
- What unique advantage does your product offer?
Example: If existing dubbing services cost $500 per video, but your AI-powered tool can do it for $50, you have a competitive pricing advantage.
Market Research Surveys: Quantifying Potential Reach
- Conduct surveys to validate demand.
- Test price sensitivity and feature preferences.
- Use polls, landing pages, and pre-orders to gauge interest.
Example: A landing page promoting your AI dubbing tool gets 5,000 signups in a month, indicating real customer interest before launch.
Build Lean. Learn Fast.
Launch an MVP that saves money while proving your concept works.
Step 3: Use the Market Size Calculation Formula
Now that you have data, use a market size formula to estimate potential revenue.
Market Size Formula
Market Size=Number of Potential Customers×Average Revenue Per Customer (ARPU)\text{Market Size} = \text{Number of Potential Customers} \times \text{Average Revenue Per Customer (ARPU)}Market Size=Number of Potential Customers×Average Revenue Per Customer (ARPU)
Example Calculation:
- Estimated 500,000 YouTube creators need dubbing services.
- Your AI tool charges $50 per month.
- Market Size = 500,000 × $50 × 12 months = $300M/year TAM.
Refining the Calculation:
- If only 20% of creators can afford the tool, SAM = $60M/year.
- If you capture 5% of SAM, SOM = $3M/year in revenue.
Applying the Formula in Real Scenarios
| Market Level | Numbers of Customers | Price per User (Annual) | Market Size |
TAM (Total Market) | 5M creators worldwide | $600 | $3B |
SAM (Your Reachable Market) | 1M creators (language-focused) | $600 | $600M |
SOM (Your Capturable Share) | 50,000 customers | $600 | $30M |
Common Pitfalls & Best Practices in Market Sizing
Market sizing is a crucial step in business strategy, but common mistakes can lead to inflated projections, misallocation of resources, and missed opportunities. Here’s how to avoid these pitfalls and ensure accurate, investor-friendly estimates.
Overestimating Market Size
Mistake: Assuming that your Total Addressable Market (TAM) represents your actual potential revenue.
Why It’s a Problem: Not every potential customer in the market will be reachable (SAM) or convertible (SOM).
Fix: Use SAM and SOM to narrow down realistic market penetration.
Example: If your AI dubbing tool has a TAM of $1B, but only 30% of content creators use AI tools, your SAM is $300M, not $1B.
Ignoring Geographical Limitations
Mistake: Assuming your product has universal demand without considering regional factors.
Why It’s a Problem: Different countries and regions have varying consumer behaviors, regulations, and purchasing power.
Fix: Adjust projections based on regional adoption rates, infrastructure, and language preferences.
Example: AI video dubbing might see high adoption in India and Latin America (content-heavy regions), but lower traction in markets with low video production activity.
Using Unrealistic Pricing Assumptions
Mistake: Setting revenue projections based on ideal price points rather than actual customer willingness to pay.
Why It’s a Problem: If your pricing is too high, conversion rates will be lower than expected. If too low, revenue may not cover costs.
Fix: Conduct pricing sensitivity research through surveys, A/B testing, and competitor benchmarking.
Example: If competitors charge $50/month but surveys show $30 is the acceptable range, adjust pricing models accordingly.
Relying on Unverified Data Sources
Mistake: Using outdated or biased reports without cross-referencing multiple sources.
Why It’s a Problem: Many market reports inflate numbers to attract investors or become outdated quickly.
Fix: Validate market size estimates using:
- Industry reports (Statista, McKinsey, Gartner)
- Customer surveys and competitor benchmarks
- Direct user testing and sales data
Example: A 2019 market report might show a $5B market, but updated data from 2024 might indicate stagnation or decline.
Best Practices for Your Startup Accurate Market Sizing
- Use a Hybrid Approach – Combine Top-Down, Bottom-Up, and Value-Theory methods for realistic estimates.
- Validate with Real Customer Data – Use surveys, beta tests, and conversion tracking instead of assumptions.
- Consider Regional & Industry Factors – Adjust for geographical demand, regulations, and competition.
- Test Pricing Sensitivity – Research customer willingness to pay to avoid over- or underpricing.
- Stay Updated on Market Trends – Monitor tech shifts, emerging competitors, and industry growth.
- Provide Conservative Projections – Use worst-case, likely, and best-case scenarios to improve credibility.
Resources for Determining Market Size
Online Analysis Tools – Use platforms like Google Trends, Statista, and IBISWorld to analyze industry trends and market demand.
Financial Reports – Study public company filings, investor reports, and industry whitepapers to gauge market size.
Industry Expert Insights – Leverage interviews, webinars, and thought leadership articles from key players in your sector.
Market Research Platforms – Access data from Nielsen, Gartner, Forrester, and McKinsey for deep industry insights.
Conclusion
Market sizing is more than a planning exercise, it’s a way to test whether a startup idea can realistically turn into a sustainable business. Understanding TAM, SAM, and SOM helps founders move from assumptions to clarity, revealing who the product is truly for, how big the opportunity is, and where early focus should be placed.
When market size is calculated thoughtfully, it guides MVP scope, pricing, go-to-market decisions, and investor conversations with confidence. Instead of chasing large numbers, startups that ground their strategy in credible market data are better positioned to reduce risk, adapt faster, and build products that align with real demand.

Murtuza Kutub
A product development and growth expert, helping founders and startups build and grow their products at lightning speed with a track record of success. Apart from work, I love to Network & Travel.