Mastering Performance Testing with JMeter: A Comprehensive Guide

Apache JMeter is a tool I’ve consistently relied on whenever performance testing stops being optional and starts being critical. I’ve used it to simulate real production traffic, uncover hidden bottlenecks, and answer the one question teams worry about before launch: will this system actually hold up under load? In this beginner's guide, we'll give a JMeter tutorial covering the basics of performance testing using JMeter.
What is JMeter?
Do you want to know what is JMeter in software testing? When developers ask me what JMeter is in practical terms, I describe it as a Java-based tool that lets me behave like thousands of real users hitting an application at once. While it started with web testing, I now use it across APIs, databases, and messaging systems where performance failures are expensive. JMeter is used for loading and performance testing different server types, including:
- Web - HTTP, HTTPS
- SOAP / REST web services
- FTP
- Databases via JDBC
- LDAP
- Message-oriented middleware (MOM) via JMS
- Mail - SMTP(S), POP3(S) and IMAP(S)
- Native commands or shell scripts
- TCP connections
The Role of JMeter in Performance Testing
In real projects, JMeter becomes less about testing and more about decision-making. I use it to validate scalability, expose breaking points, and understand how an application behaves before real users experience failure. Here’s how you can start performance testing using JMeter:
1. Load Testing
JMeter load testing can simulate multiple users accessing a web application simultaneously, helping to assess how the application performs under heavy loads. It identifies performance bottlenecks and ensures that the application can handle peak traffic without issues.
2. Scalability Testing
By testing the application with an increasing number of users, JMeter helps determine the scalability of the application. This ensures that the application can grow and perform well as the user base expands. Scalability testing in JMeter is crucial for understanding how well your application can handle growth.
3. Stress Testing
JMeter pushes the application to its limits by simulating extreme conditions, such as high traffic spikes. This helps identify the application's breaking point and ensures it can recover gracefully from failures.
4. Integration with CI/CD
JMeter integrates seamlessly with Continuous Integration/Continuous Deployment (CI/CD) pipelines, enabling automated performance testing. This ensures that performance tests are run consistently with every code change, catching performance regressions early in the development cycle.

5. Protocol Support
JMeter supports a wide range of protocols, including HTTP, HTTPS, FTP, JDBC, and more. This makes it a versatile tool for testing various types of applications, from web services to databases.
6. Real-Time Reporting and Analytics
It provides detailed real-time reports and analytics on various JMeter performance metrics, such as response times, throughput, and error rates. This data helps teams make informed decisions about performance improvements.
7. Scripting and Extensibility
With its support for scripting through languages like Groovy and its extensive plugin ecosystem, JMeter allows for highly customizable and extendable test plans, catering to specific testing needs.
8. Performance Metrics Monitoring
JMeter provides a range of performance metrics, such as response times, throughput, error rates, and server resource utilization, allowing testers to monitor and analyze the performance of the application comprehensively.
Why Use Jmeter?
JMeter is open-source software which is freely available and can be customized to fit your specific testing needs. Many organizations that offer software testing services rely on JMeter to conduct thorough performance and load testing, ensuring applications can handle expected traffic and function correctly under stress.
Setting Up JMeter
Setting up JMeter is straightforward, but I’ve learned that small misconfigurations, especially around Java and environment variables, can quietly derail tests. Getting this right upfront saves hours of debugging later.
- Operating System: JMeter is platform-independent and can run on Windows, macOS, and Linux.
- Check if Java is already installed:
- Open a command prompt (Windows) or terminal (macOS/Linux).
- Type java -version and press Enter.
- If Java is not installed, download and install it from the Oracle JDK website or AdoptOpenJDK.
- Set up the JAVA_HOME environment variable: Setting up the JAVA_HOME variable is essential for JMeter to locate Java.
For Windows
- Right-click on 'This PC' or 'Computer' on your desktop or in File Explorer.
- Select 'Properties'.
- Click on 'Advanced system settings'.
- In the System Properties window, click on the 'Environment Variables...' button.
- In the Environment Variables window, click 'New...' under 'System variables'.
- Enter JAVA_HOME as the variable name and the path to your JDK installation (e.g., C:\Program Files\Java\jdk-14) as the variable value.
- Click 'OK' to save the new variable.
For macOS/Linux
- Open a terminal.
- Open your profile file with a text editor (e.g., nano ~/.bash_profile or nano ~/.zshrc for macOS, nano ~/.bashrc for Linux).
- Add the following line at the end of the file:sh
export JAVA_HOME=/path/to/your/jdk
Replace /path/to/your/jdk with the actual path to your JDK installation.
Save the file and run source ~/.bash_profile (or the appropriate file for your shell) to apply the changes.
Familiarize yourself with the GUI. The main elements are Test Plan, WorkBench, and Tree View.
Simple Test Plan Structure
- Test Plan: I treat the JMeter test plan as a performance blueprint. A clean structure makes test results easier to interpret and prevents false conclusions when something breaks under load, providing a structured approach to ensure thorough testing coverage and effective management of testing efforts.
- Thread Group: Manages virtual users (threads) and their behaviour during a test. It defines the number of users, ramp-up period, and test duration.
- HTTP Request Defaults: Sets default values for HTTP requests within its scope, such as server name and protocol. It reduces redundancy in HTTP request configurations.
- HTTP Request: Sends an HTTP request to a web server. Includes parameters like method (GET, POST), path, and optional headers or body data.
- Constant Timer: Adds a constant delay between requests sent by each thread. This helps simulate realistic user behaviour and manage server load.
- Response Assertion: Checks the response content against expected patterns or values. It validates whether the server's responses meet specified criteria.
- View Results Tree: Displays the response data for each sample in a tree or table format. It is useful for debugging and analyzing individual request/response details.
- Aggregate Report: Generates aggregate performance test results, including average response times, throughput, and error rates. This provides insights into overall test performance.
Sleep Easy Before Launch
We'll stress-test your app so users don't have to.
Creating a Basic Test Plan
A Test Plan defines the tests you want to run. Here's a basic example:
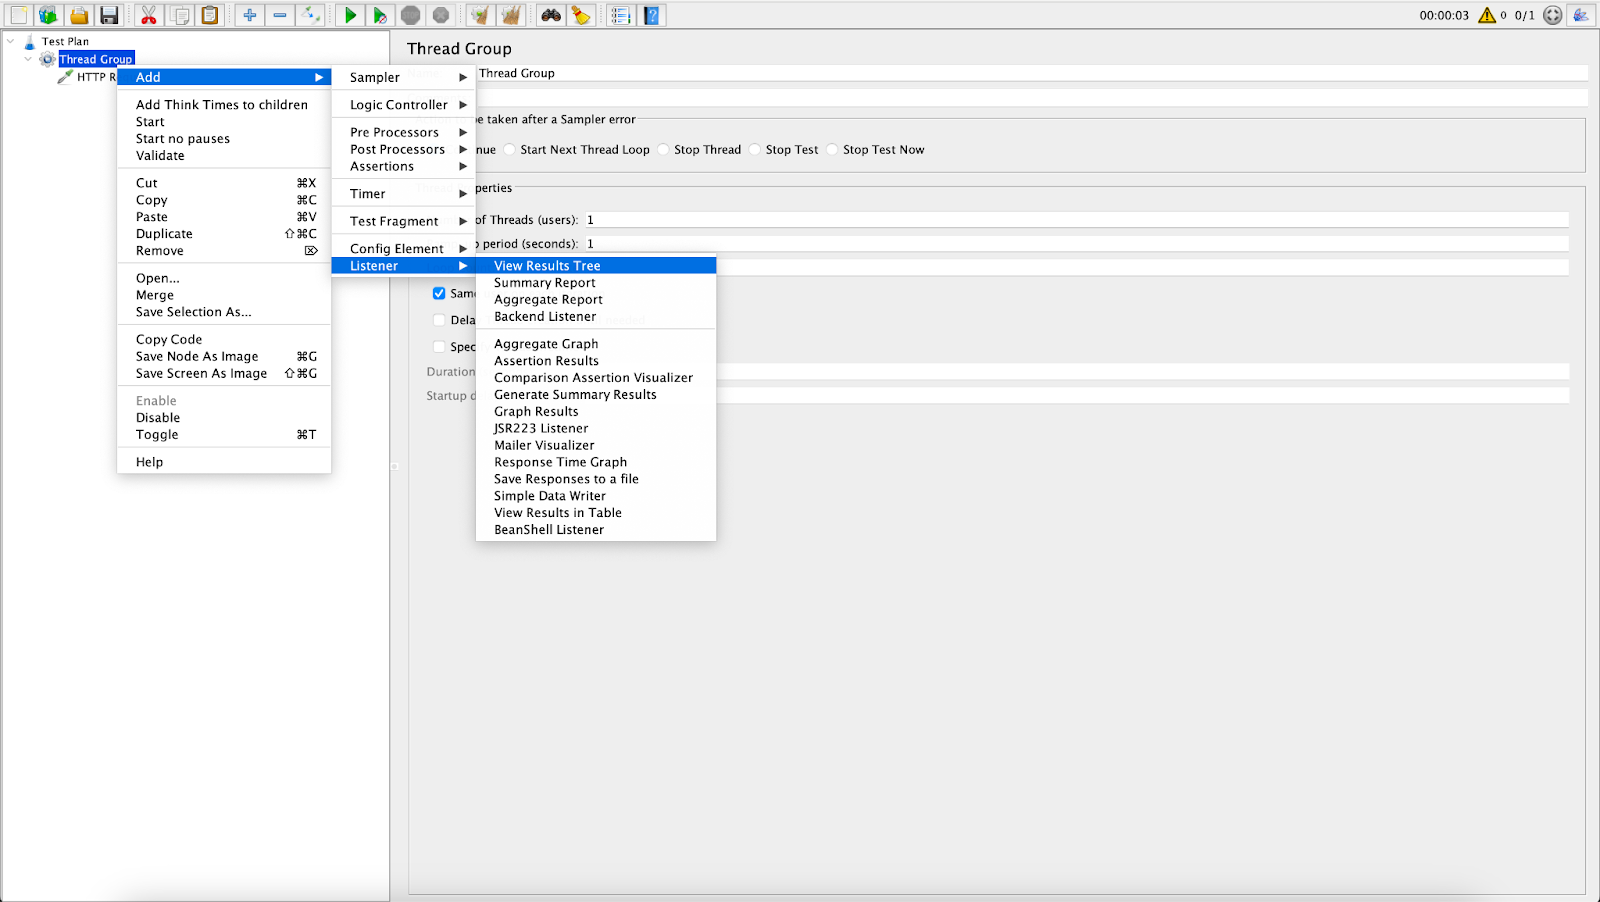
- Add a Thread Group which defines the number of virtual users and their behaviour. This represents a group of users. Right-click on Test Plan > Add > Thread (Users) > Thread Group.
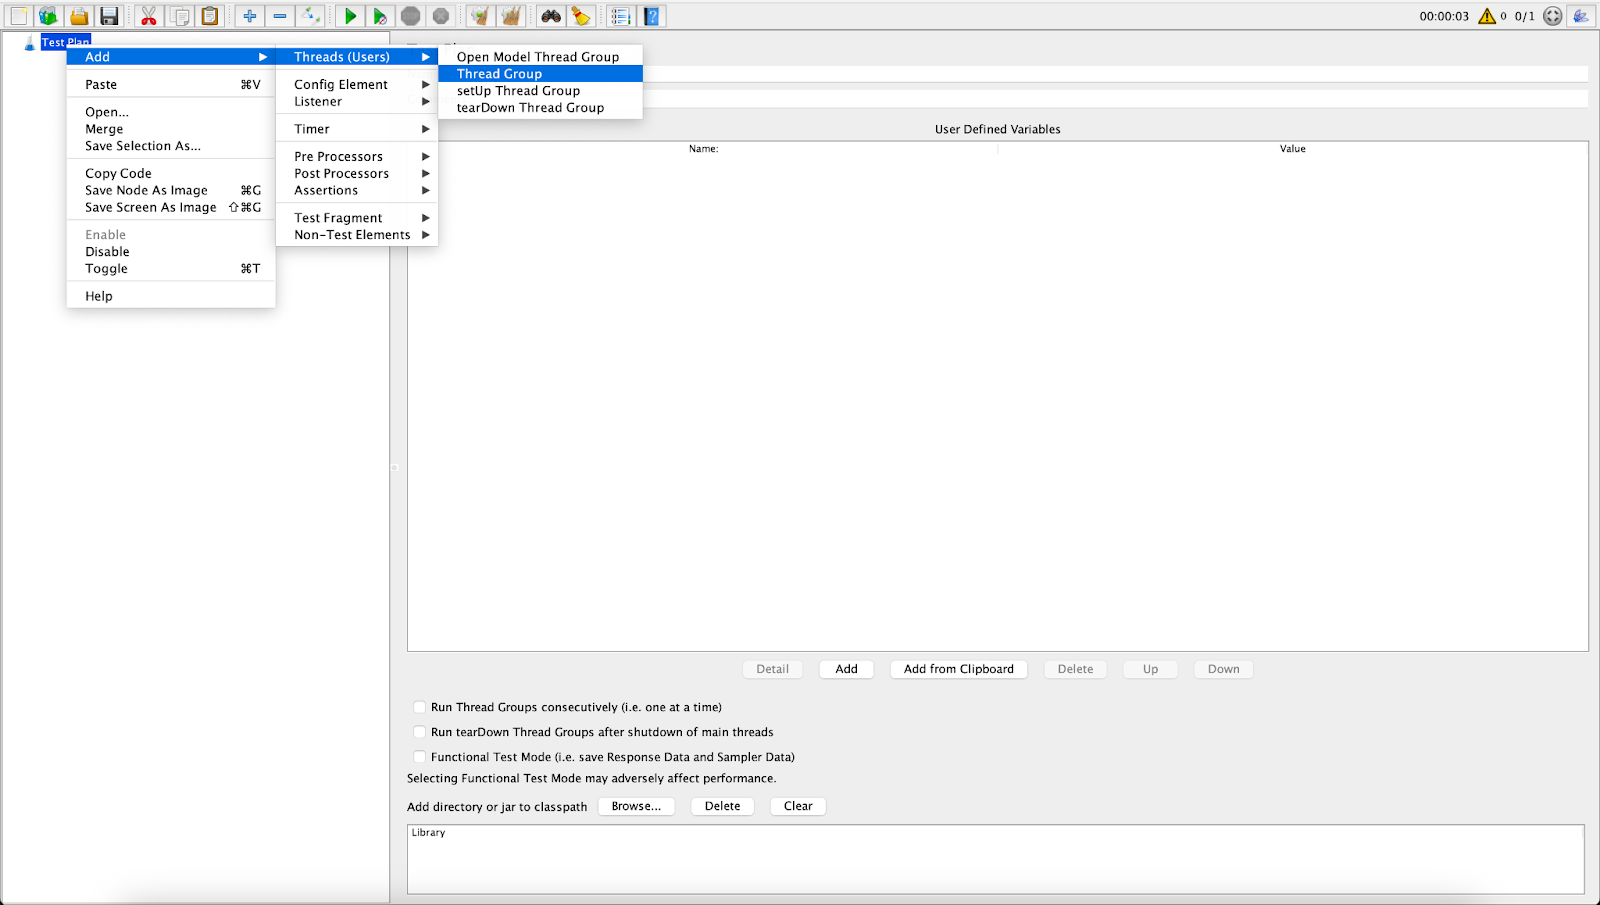
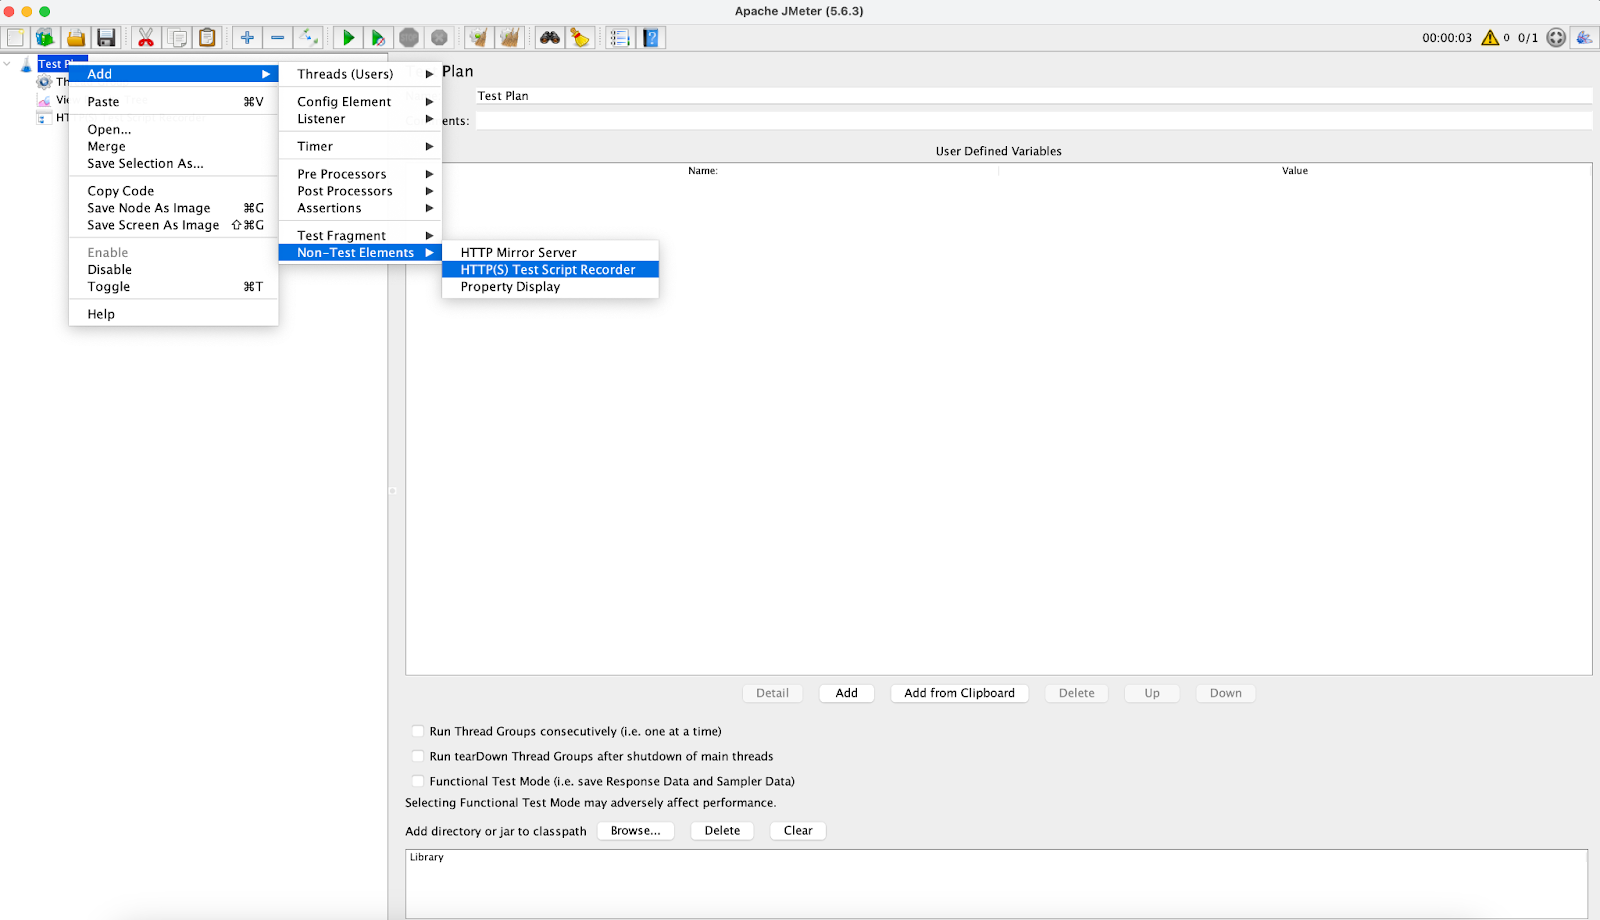
- Add an HTTP(S) Test Script Recorder. Right-click Test Plan > Add > Non-Test Elements > HTTP(S) Test Script Recorder.
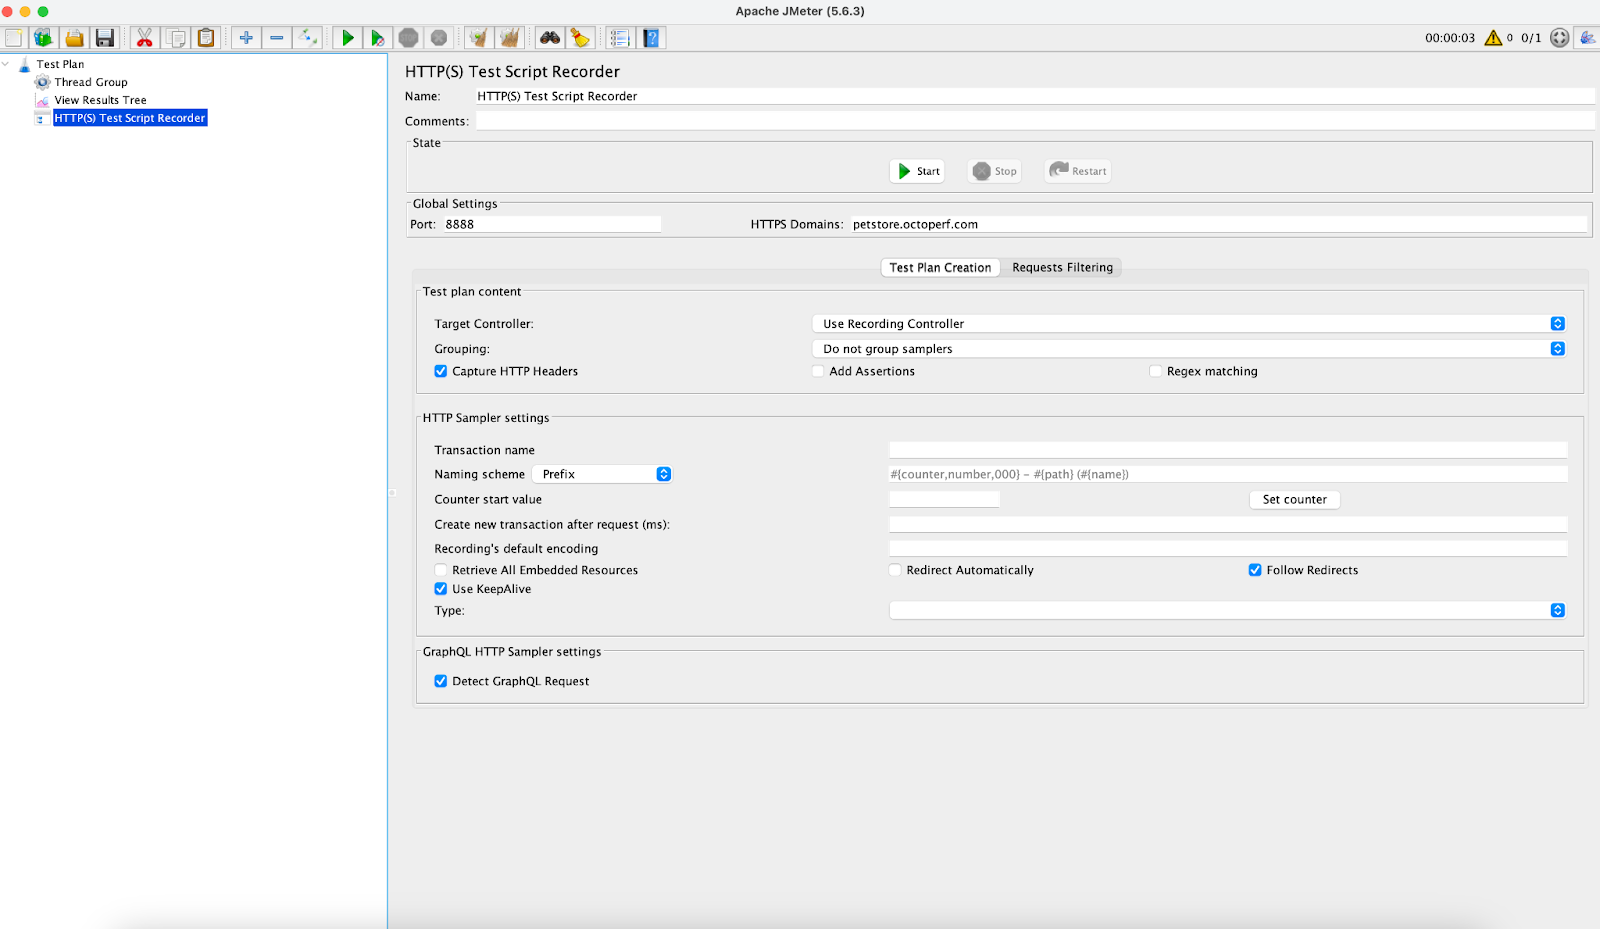
- Configure the HTTP Request. Enter the Server Name (e.g., www.example.com) and add Port 8888 or 8080 which should be the same in the browser where we are planning to run the test.
- Add a Listener. This determines how results are processed and displayed. Right-click Thread Group > Add > Listener > View Results Tree.

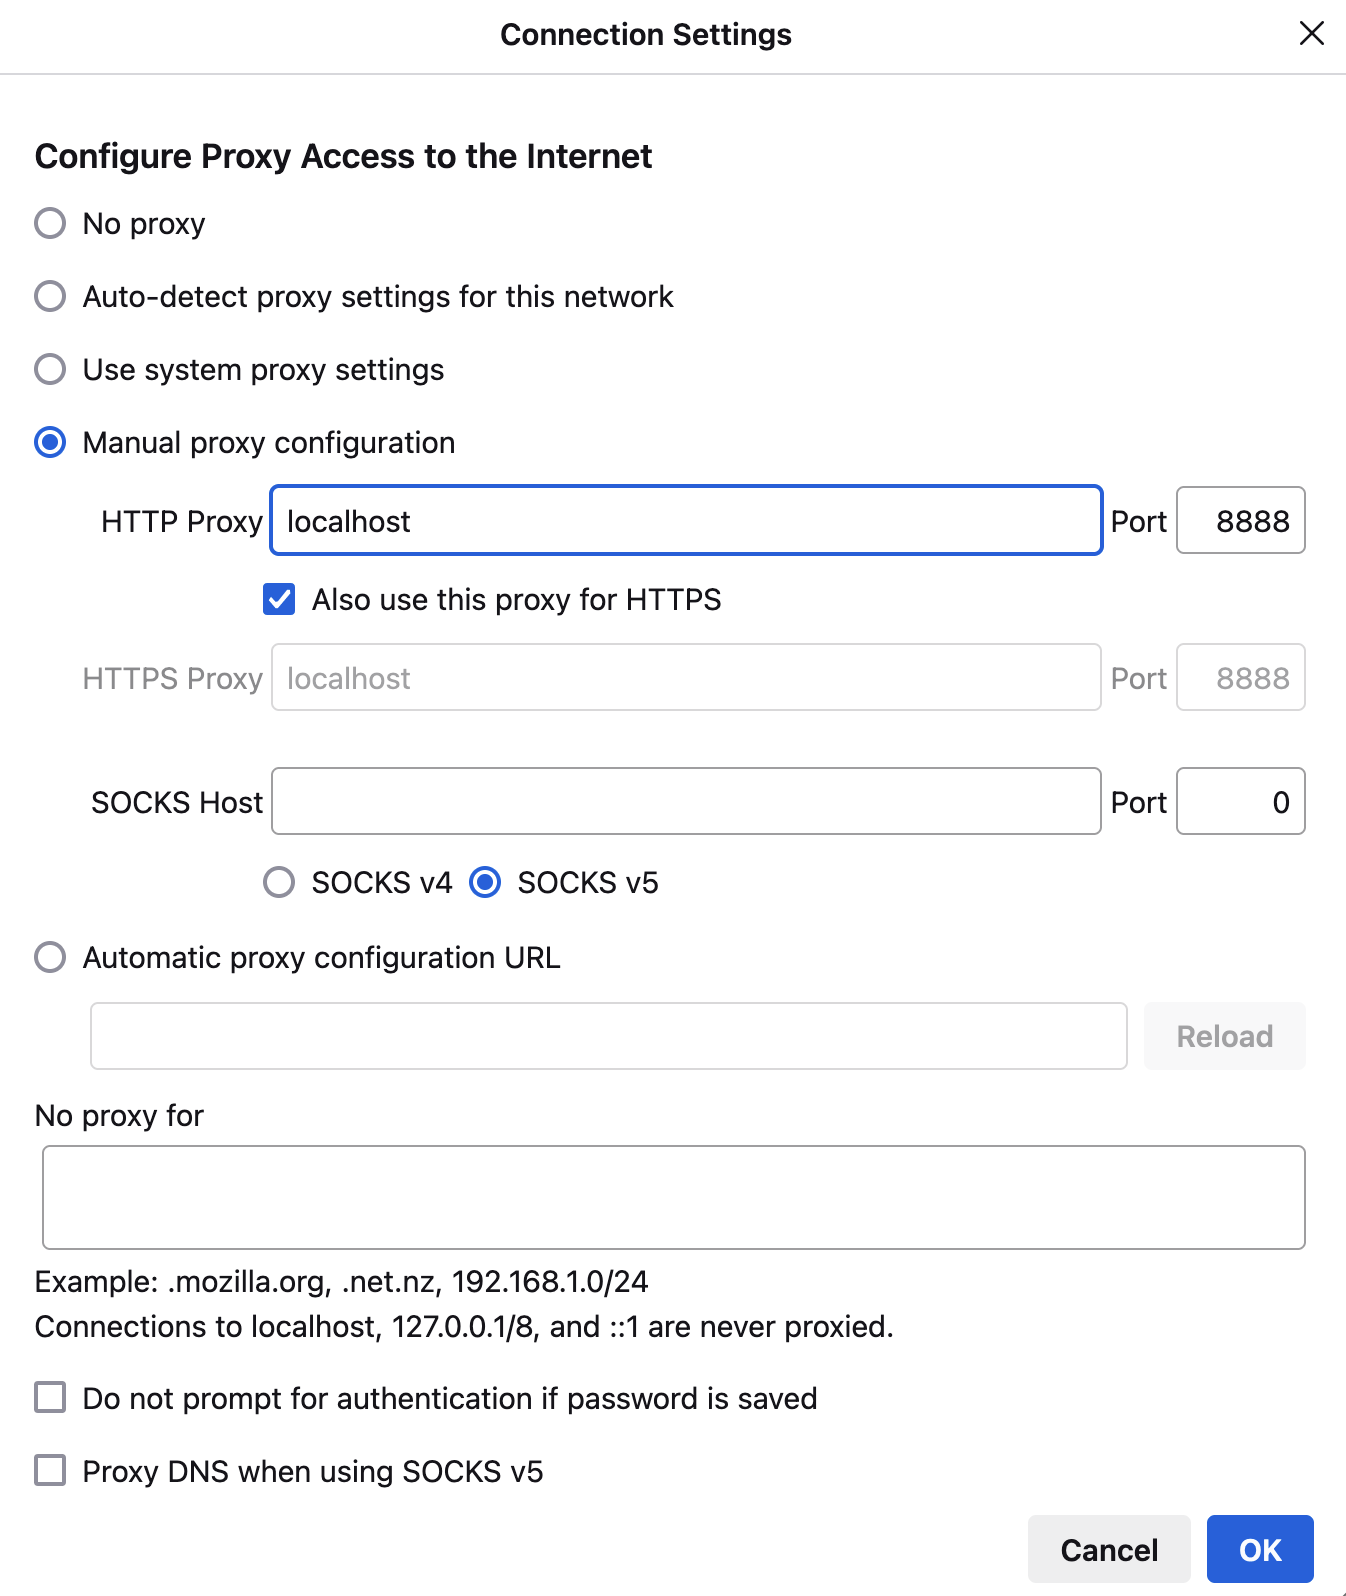
Setting up a Proxy for Firefox to Run Jmeter Configure Firefox to Use JMeter Proxy
- Open Firefox.
- Go to Settings > Network Settings > Settings.
- Select Manual proxy configuration.
- Enter localhost for the HTTP Proxy.
- Enter 8888 (or the port you configured in JMeter) for the Port.
- Check Also use this proxy server for HTTPS
- Click OK to save the settings.
Configure the JMeter Certificate
To accurately test HTTPS apps, it is essential to configure the JMeter root CA certificate. It makes it possible for JMeter to intercept and decode HTTPS communication, facilitating thorough functional and performance testing of secure endpoints. You won't be able to test secure connections without this setting, which will result in findings that are inconsistent and insufficient.
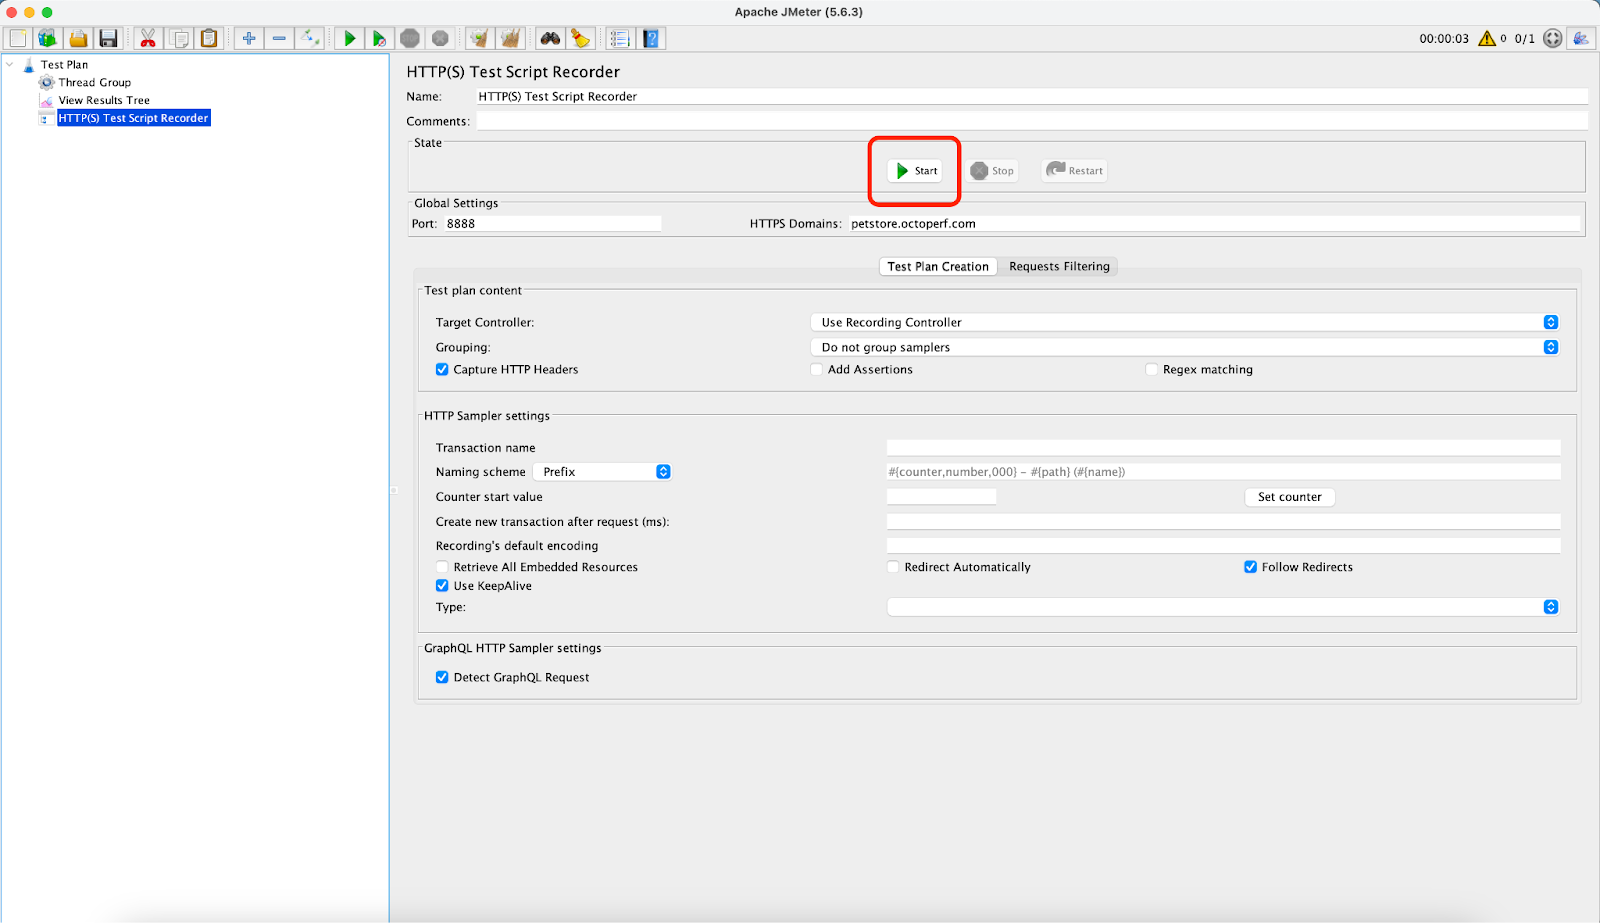
- In JMeter, under the HTTP(S) Test Script Recorder panel, find the Start button and click it.
- JMeter will prompt you to install its Root CA certificate to capture HTTPS traffic:
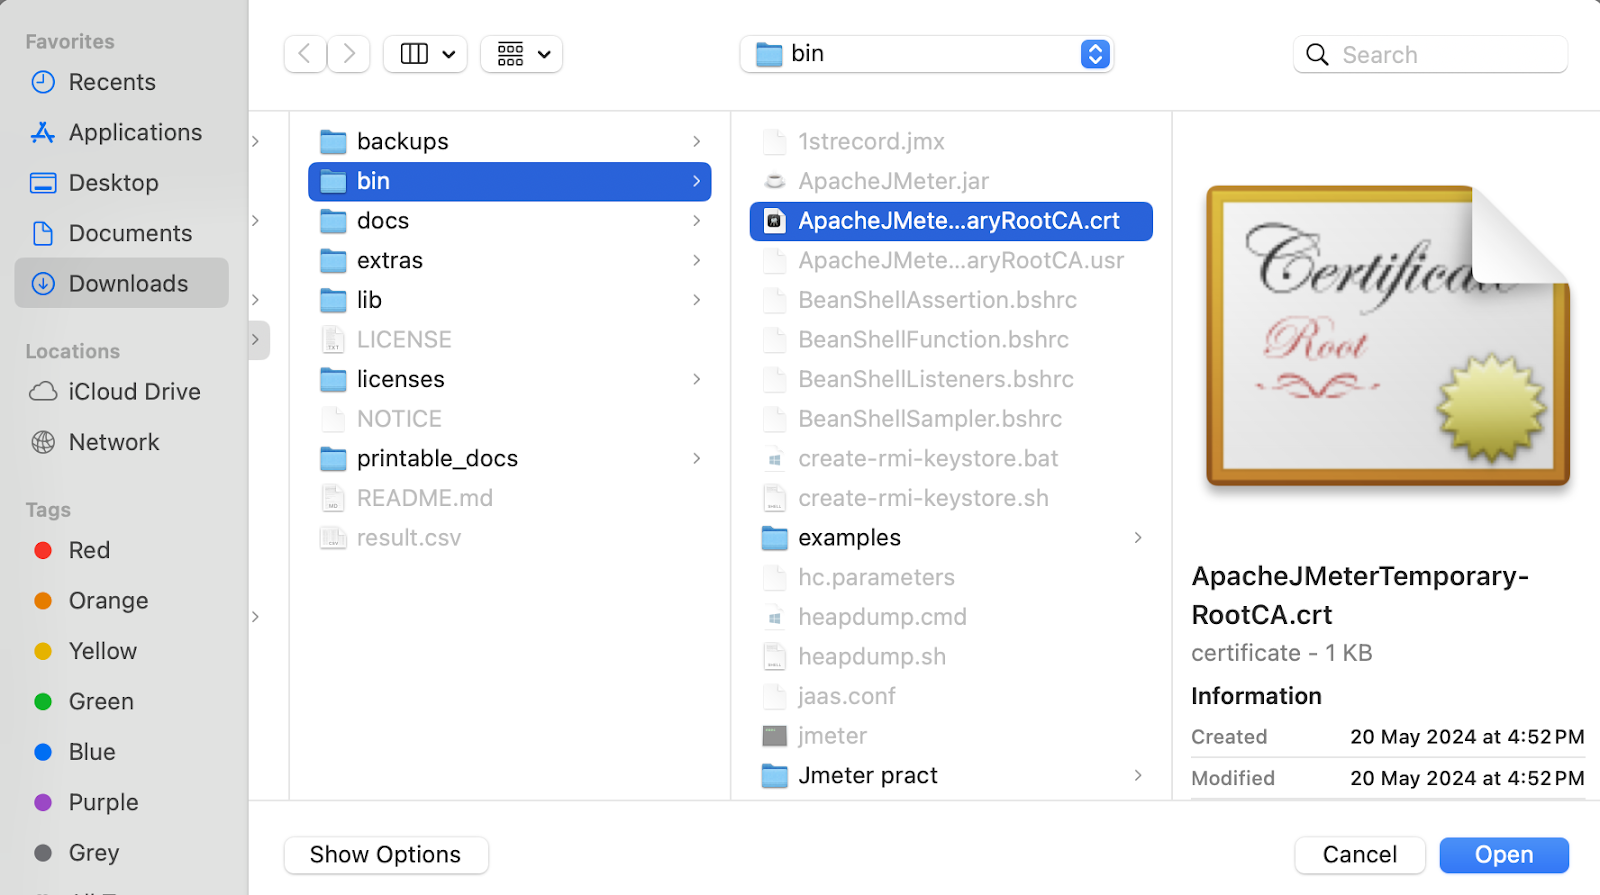
- Navigate to the ‘bin’ directory of your JMeter installation.
- Find the file ‘ApacheJMeterTemporaryRootCA.crt’.
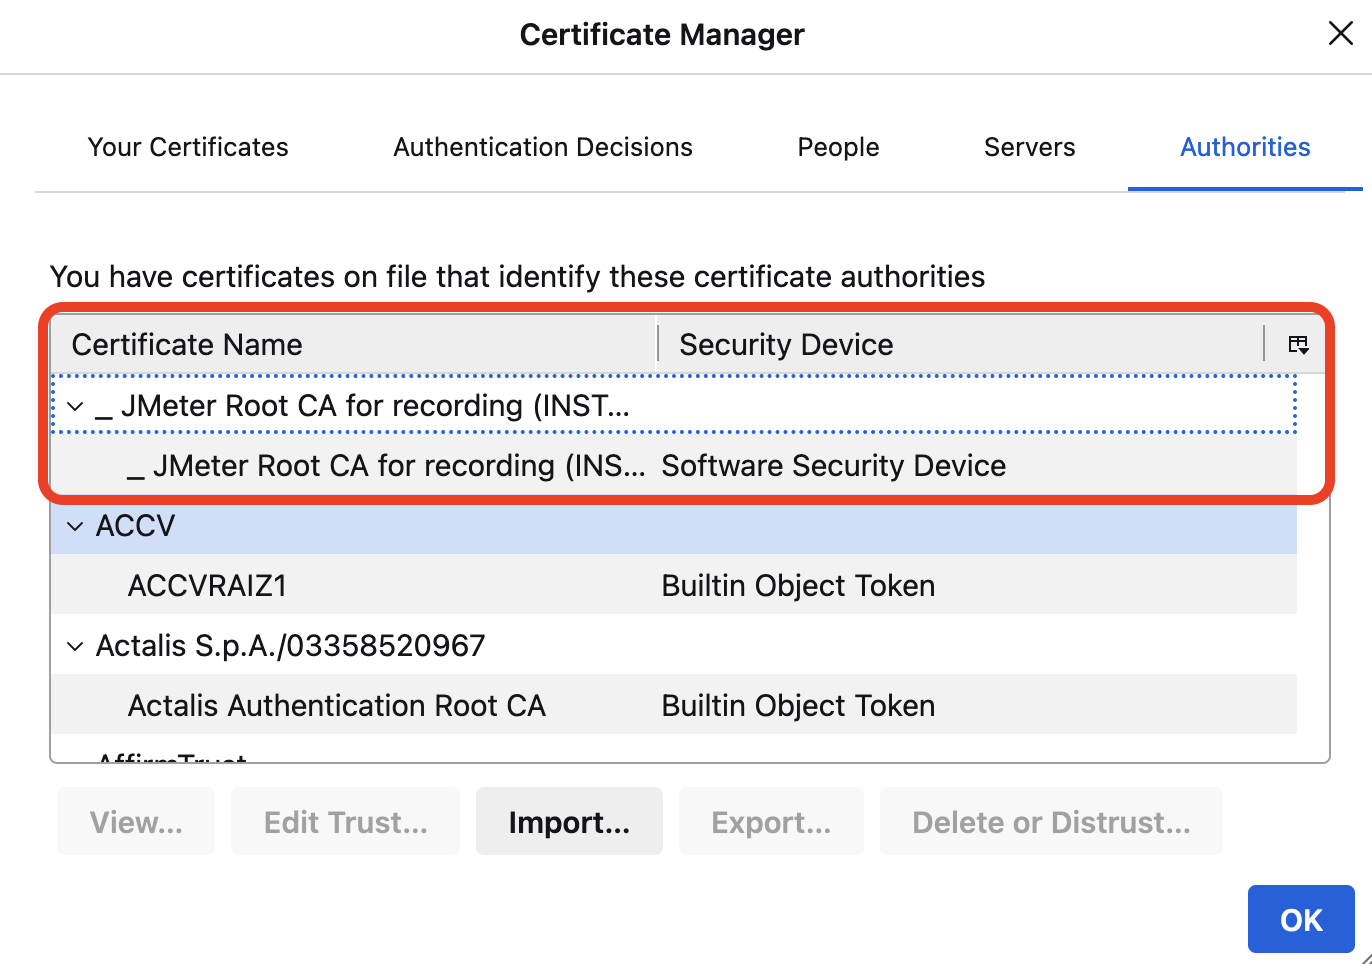
In Firefox:
- Go to Settings > Privacy & Security > Certificates > View Certificates.
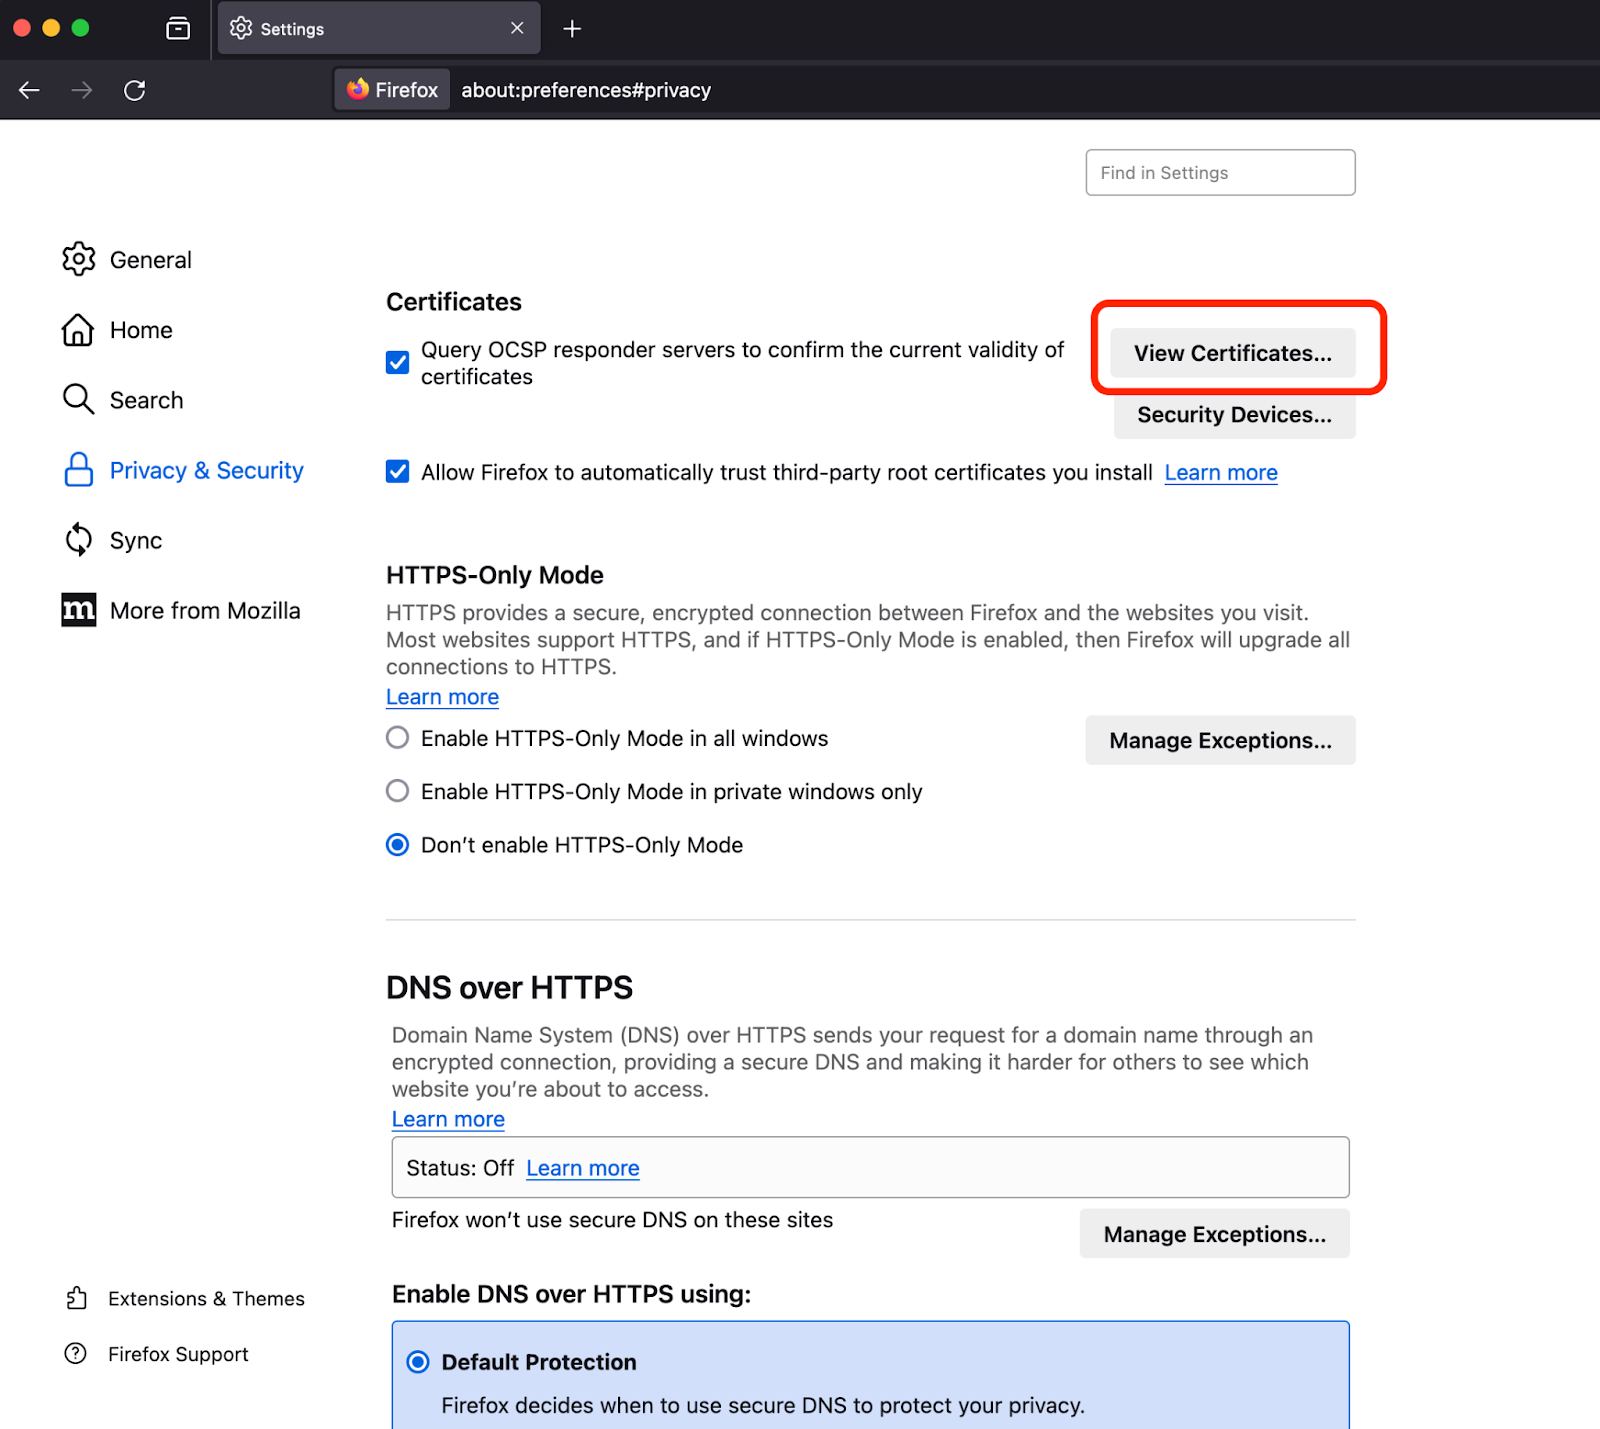
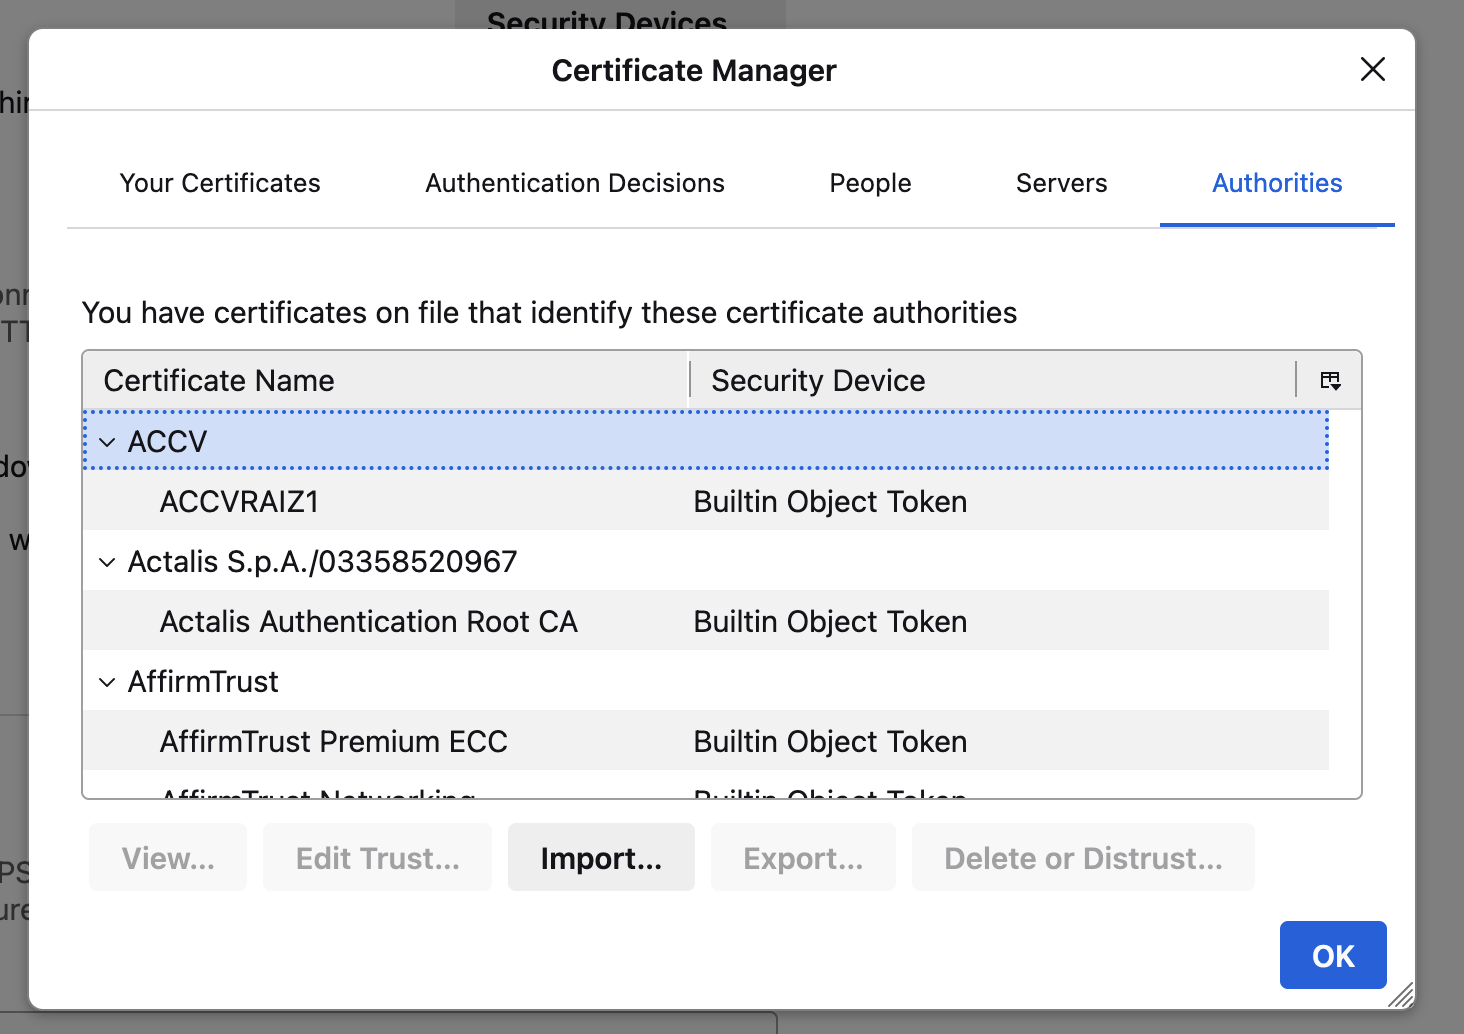
- Click Import and select `ApacheJMeterTemporaryRootCA.crt`.and click on Open
- Check the Trust this CA to identify websites.
- Click the OK button in Certificate Manager once the certificate is imported successfully.
Running Your First Test
- Save your Test Plan. Give it a name and click Save and record the script.* Select Http(s) Test script recorder* In Global Settings Enter the Port number and HTTPS Domains
* Click on Start button

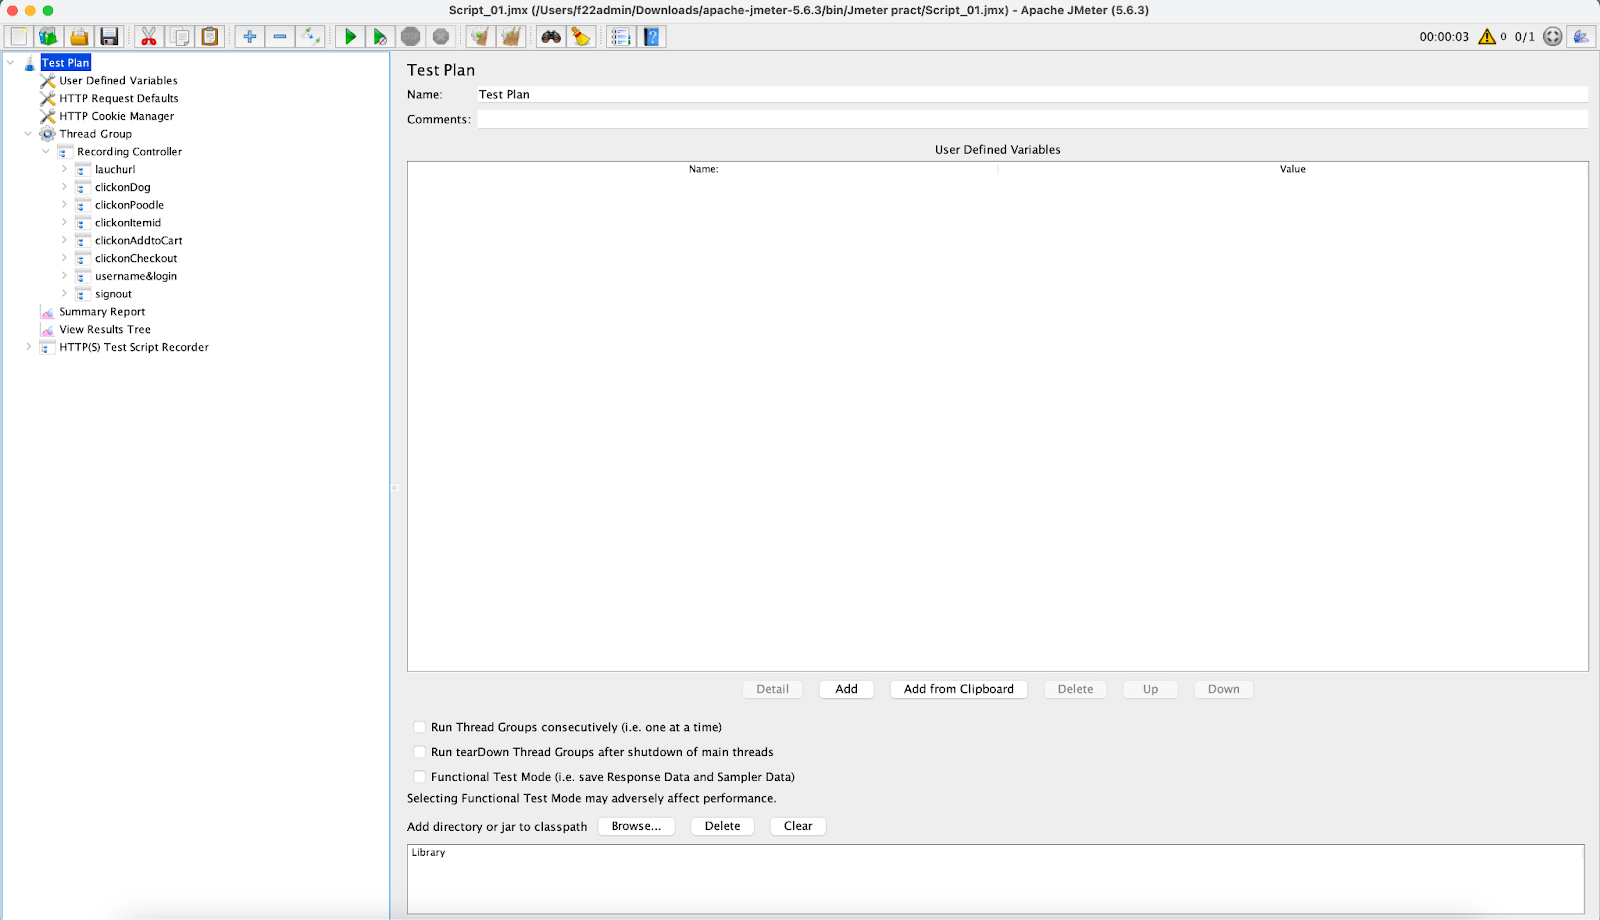
* Enter the Transaction name on each action we perform to avoid disturbances
* Perform the same flow on each click as per the requirement and here is an example of a recorded script

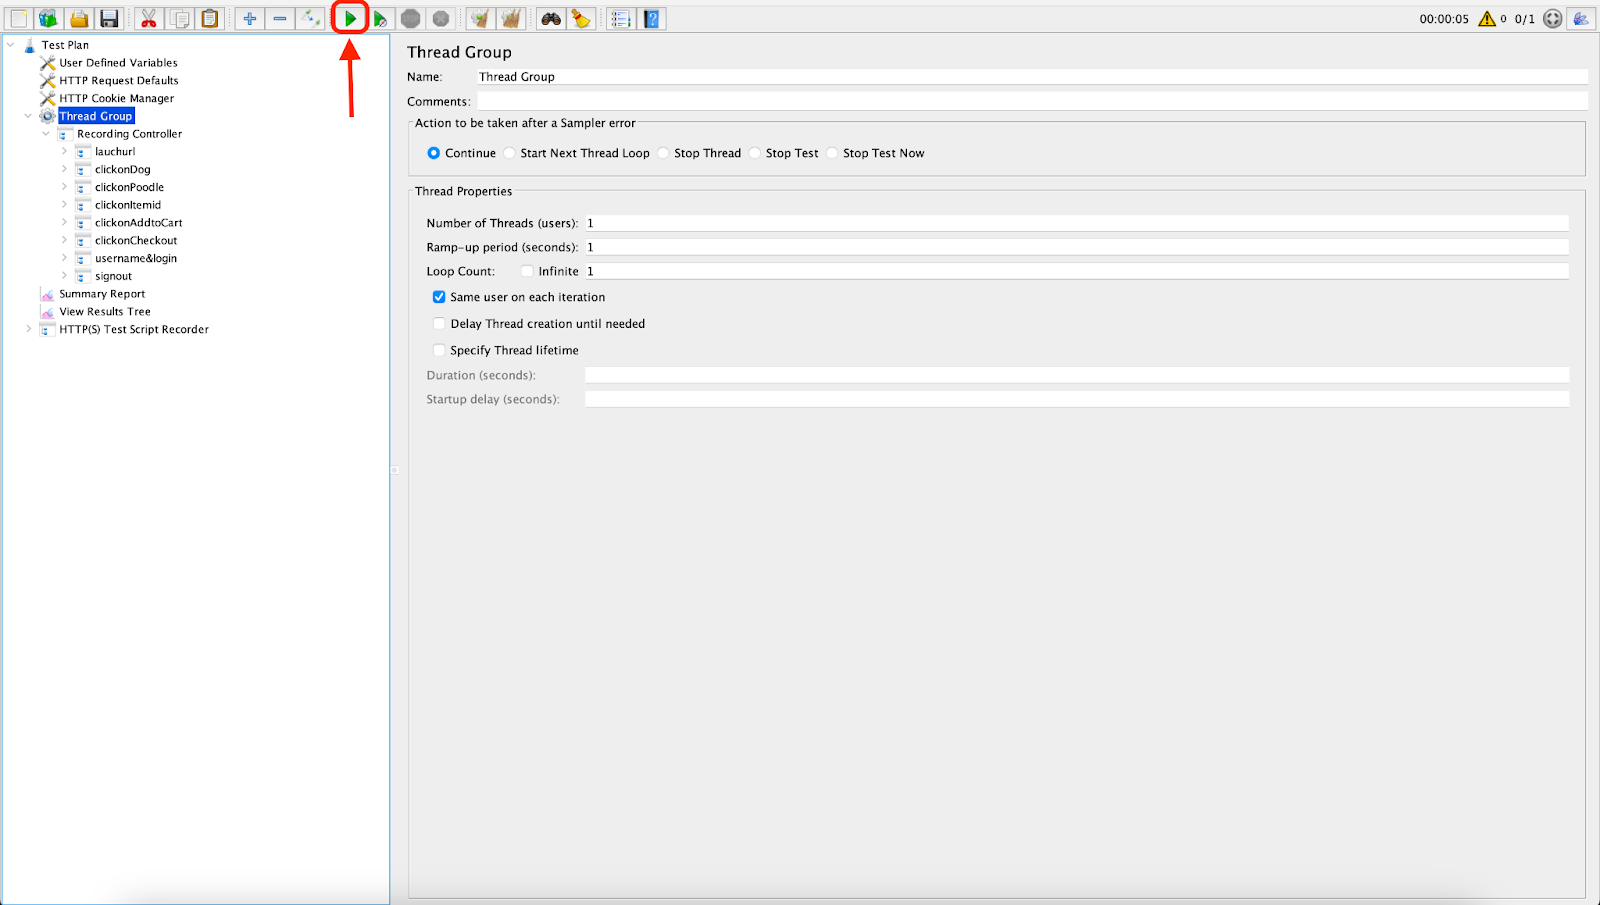
- Run the test. Click the green Run button or press Ctrl+R.
- View your results. Expand the Results Tree listener and you'll see the results of your test, including response times and any errors.

Advanced Techniques and Best Practices in JMeter
This is where JMeter starts reflecting real user behavior. Techniques like parameterization, correlation, and realistic think time are what separate trustworthy performance results from misleading ones.
1. Parameterization
Parameterization allows you to create dynamic test scenarios by replacing static values with variables. This can be achieved using:
- CSV Data Set Config: Load external CSV files to provide different data sets for each user.
- User-Defined Variables: Define variables within the JMeter test plan to be reused across various test elements.
2. Assertions and Validations
Incorporate assertions and validations to verify the expected behavior of your system. Key techniques include:
- Response Assertions: Validate response codes, response messages, and specific text within the response body.
- Duration Assertions: Ensure that response times do not exceed defined thresholds.
- Size Assertions: Verify the size of the response to detect any anomalies.
3. Think Time
Introduce think time between requests to emulate real user interactions and pauses. This can be managed using:
- Constant Timer: Add fixed delays between requests.
- Gaussian Random Timer: Introduce variability in delay times to better simulate user behavior.
Sleep Easy Before Launch
We'll stress-test your app so users don't have to.
4. Correlation
Correlation handles dynamic values and session IDs that change with each request. Techniques include:
- Regular Expression Extractor: Extract dynamic values from server responses.
- CSS/JQuery Extractor: Use CSS selectors to extract values from HTML responses.
- JSON Extractor: Extract data from JSON responses to be reused in subsequent requests.
5. Distributed Testing
Distributed testing in JMeter uses multiple machines to perform load testing on an application or server, allowing you to simulate a larger number of users more effectively than with a single machine. This technique is essential for JMeter scaling when testing large applications.
Key practices include:
- Master-Slave Configuration:
- Master: The machine that controls the test and aggregates results.
- Slaves: The machines that actually generate the load on the target server.
Network Configuration: Ensure proper network configuration to avoid bottlenecks and ensure accurate load distribution.
6. Monitoring and Analysis
Integrate monitoring and analysis tools to gain deeper insights into your system's performance. Effective tools and practices include:
- Grafana: Use Grafana for visualizing real-time performance metrics from JMeter.
- ELK Stack (Elasticsearch, Logstash, Kibana): Aggregate and analyze logs for comprehensive performance analysis.
- APM Tools (e.g., New Relic, Dynatrace): Monitor application performance and detect performance bottlenecks at the application layer.
7. Additional Best Practices
- Script Reusability: Design modular and reusable scripts to simplify maintenance and updates.
- Pre-Testing Validation: Validate your test scripts in a controlled environment before executing full-scale tests.
- Performance Baselines: Establish performance baselines to measure improvements or regressions over time.
- Result Analysis: Perform a thorough analysis of test results, focusing on key performance indicators (KPIs) like response time, throughput, error rate, and resource utilization. Many teams also align these findings with the right KPI for QA teams to measure testing effectiveness across projects.
By incorporating these advanced techniques and best practices, you can enhance the accuracy and reliability of your performance testing with JMeter, ensuring comprehensive and realistic load testing scenarios.
Key Performance Metrics to Monitor
- Response Times: Check how quickly your system responds under different loads. Look for spikes or anomalies that could signal performance issues or resource constraints.
- Throughput: Measure how many requests your system processes per unit of time. Higher throughput means better performance and scalability.
- Error Rates: Track the number of errors during tests. High error rates can negatively impact performance and user experience.
- Resource Utilization: Monitor CPU, memory, and network usage. You can identify any resource bottlenecks that might affect performance.
- Scalability: Test how well your system scales by gradually increasing the load. This is to ensure that expected increases in traffic are handled efficiently.
These performance testing metrics in JMeter are critical for identifying performance bottlenecks and ensuring your application meets performance expectations.
Limitations for JMeter
I’ve learned that JMeter is powerful, but only when used for what it’s good at. Expecting browser-level realism or ignoring resource limits often leads to confidence that doesn’t survive production.
- Server-side focus: JMeter is primarily designed for server-side testing and may require additional configuration or plugins for comprehensive browser interaction testing.
- Scripting complexity: JMeter scripting involves working with various test plan elements and regular expressions, requiring some technical expertise.
- Limited real-time monitoring: JMeter provides limited real-time test monitoring capabilities compared to other tools. To obtain real-time data, you may need to integrate external monitoring tools.
- No support for certain technologies: JMeter does not natively support AJAX, JavaScript, or Flash. You may need additional plugins or workarounds to test these technologies effectively.
- Resource-intensive: Running large tests can strain your machine. To prevent this, you can use distributed testing to share the load across multiple machines.
- Challenges with complex applications: JMeter can struggle with complex modern web applications, like single-page applications (SPAs), as it may not accurately simulate real user interactions.
FAQ
1. What is Apache JMeter, and why is it used in performance testing?
Apache JMeter is an open-source performance testing tool used to simulate real user traffic and measure how applications behave under load. I use it to identify bottlenecks, stability issues, and scalability limits before production release.
2. Can JMeter be used for API and backend performance testing?
Yes. JMeter is highly effective for testing REST APIs, SOAP services, databases, and messaging systems. I rely on it primarily for backend performance validation, where most real-world performance issues originate.
3. What types of performance testing can be done using JMeter?
JMeter supports load testing, stress testing, scalability testing, and regression performance testing. This makes it suitable for validating both normal traffic conditions and extreme usage scenarios.
4. How does JMeter help in CI/CD pipelines?
JMeter integrates seamlessly with CI/CD tools like Jenkins and GitHub Actions, allowing automated performance tests to run with every build. This helps detect performance regressions early instead of after deployment.
5. What are the most important metrics to monitor in JMeter?
Key metrics include response time, throughput, error rate, and resource utilization. I use these metrics together to judge whether an application is production-ready under expected and peak loads.
6. What are the limitations of JMeter?
JMeter operates at the protocol level and does not render JavaScript like a browser. It also requires careful scripting and system resources for large-scale tests. I treat it as a performance tool, not a UI testing solution
7. When should performance testing with JMeter be performed?
Performance testing should start early and continue throughout development. I’ve seen the best results when JMeter tests are run before major releases and continuously as part of automated pipelines.
Conclusion
From pre-release validation to CI pipelines, JMeter has helped me turn performance from a last-minute concern into a measurable engineering discipline. Used correctly, it gives teams confidence, not surprises, under load. Setting up JMeter is straightforward, and creating test plans can be tailored to meet specific requirements, ensuring thorough performance assessments. By following the techniques given above, users can maximize the effectiveness of their performance testing efforts.

Surya
I'm a Software Tester with 5.5 years of experience, specializing in comprehensive testing strategies and quality assurance. I excel in defect prevention and ensuring reliable software delivery.